
A clearer view.
Across your operation.
From people and assets to products and processes. Explore where visual intelligence can make a practical difference.
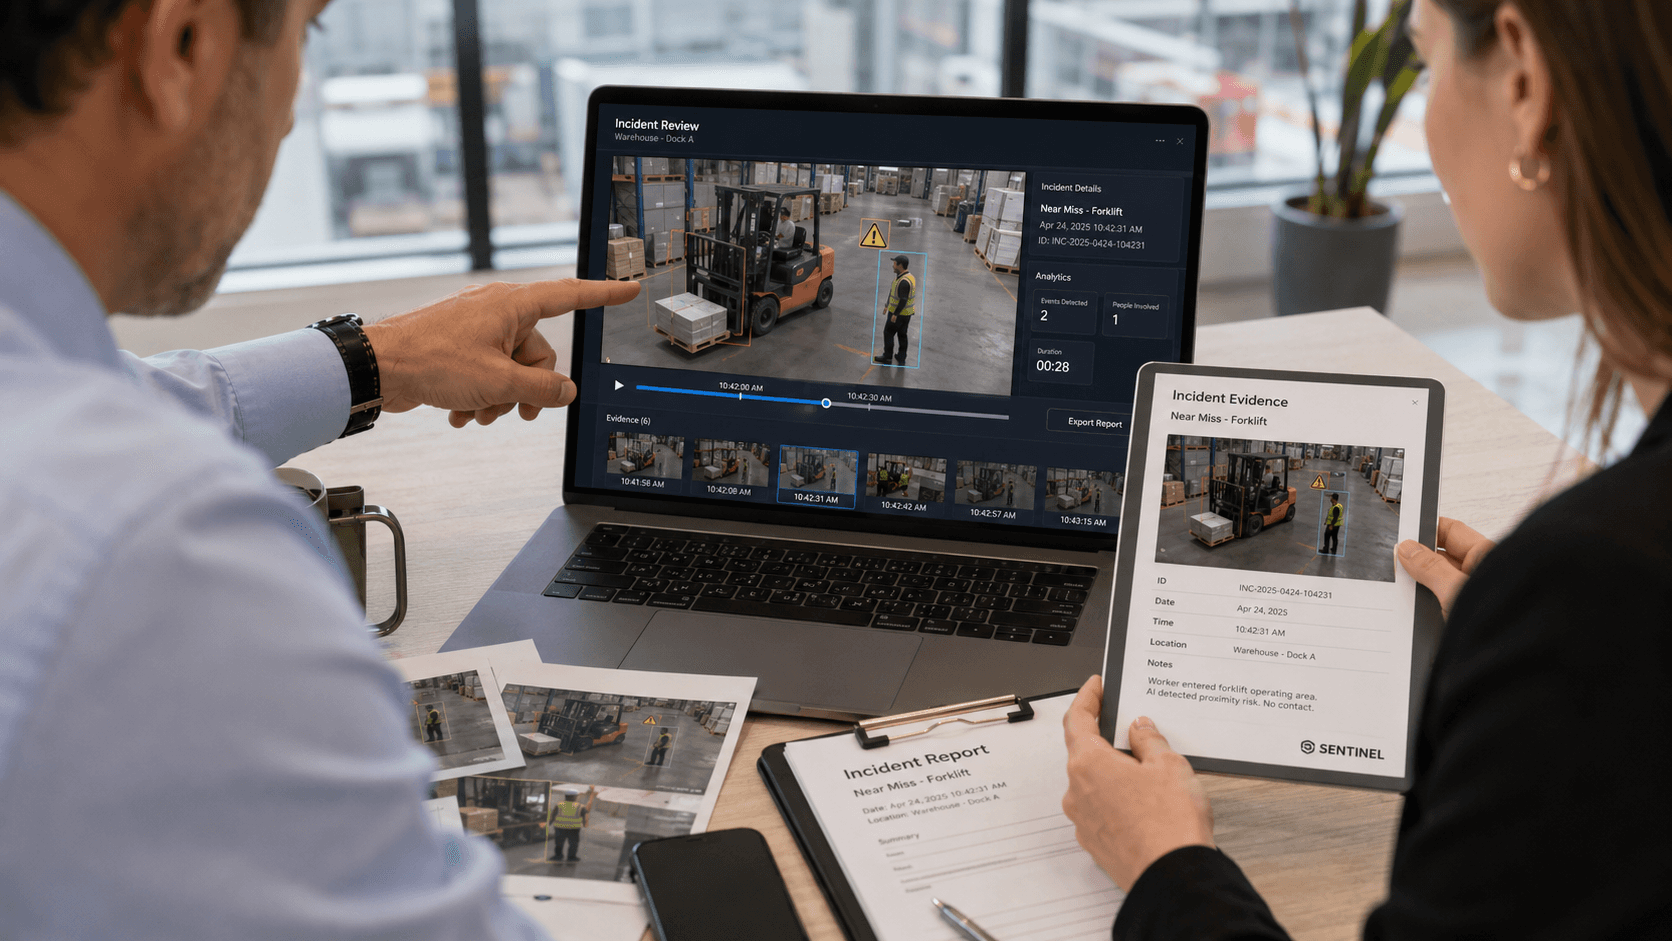
Spot the near miss. Prevent the next one.
Identify PPE gaps, people entering restricted zones and unsafe proximity between people and vehicles. Give EHS teams context to investigate recurring risks and improve prevention.
- PPE and safety-zone monitoring
- Forklift–pedestrian interactions
- Near-miss evidence and review
 02 / SECURITY & LOSS PREVENTION
See the risk before it becomes a loss.
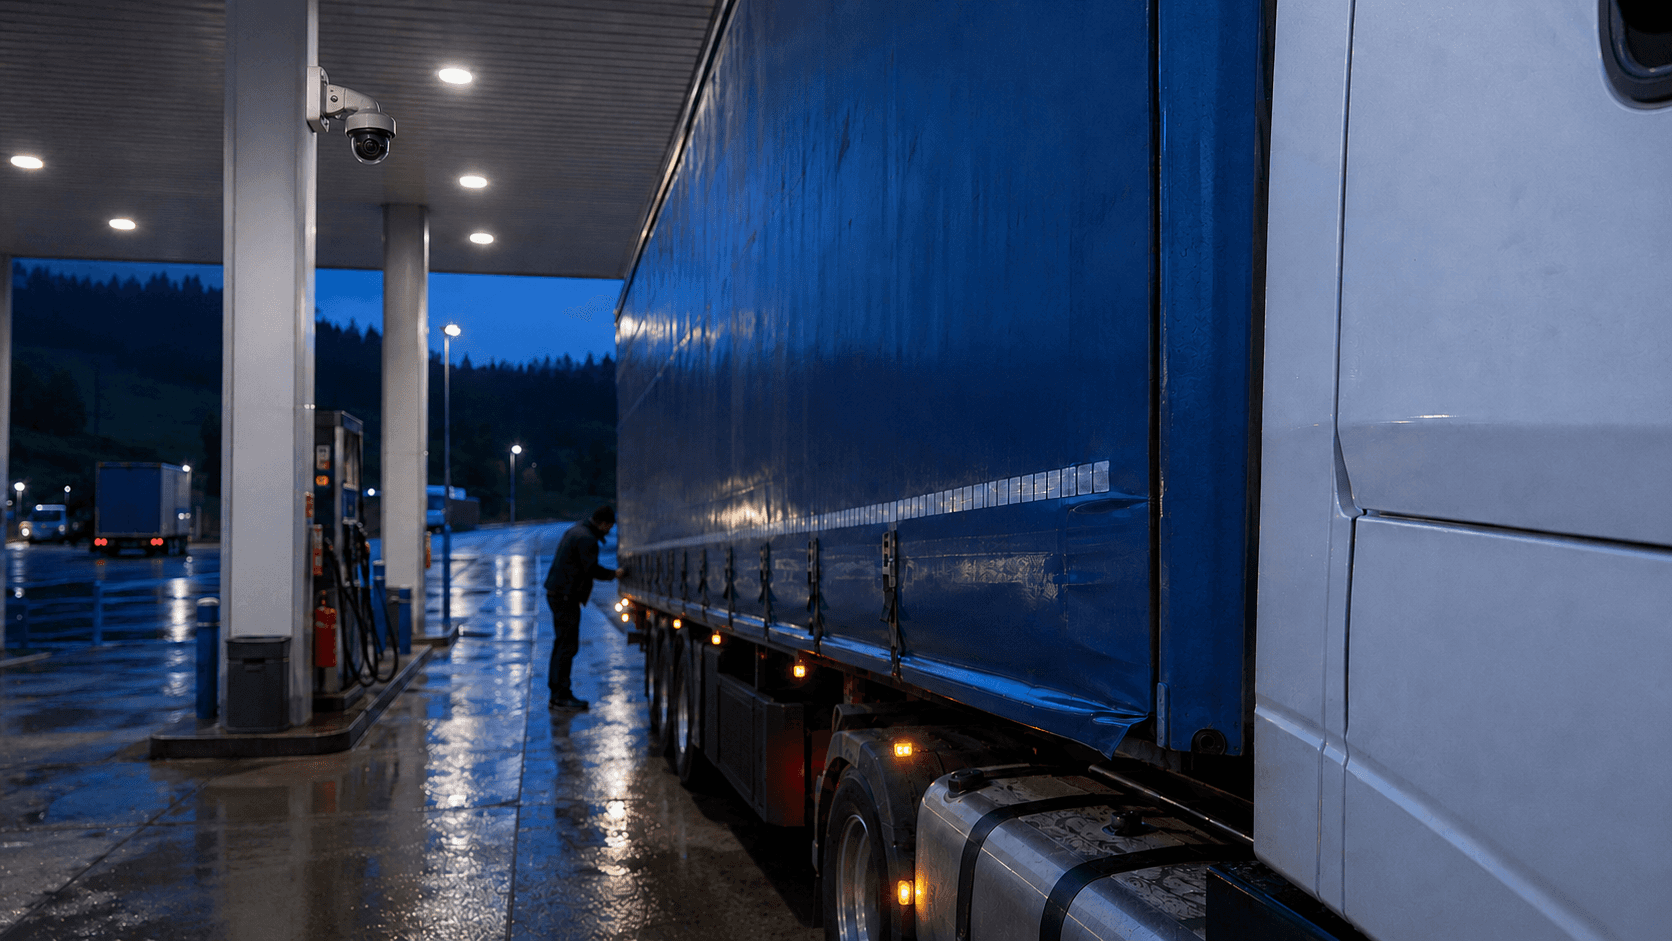
Monitor selected CCTV and vehicle camera feeds for intrusion, suspicious activity and tampering. Support the protection of cargo, vehicles, fuel and outdoor assets with event-based alerts.
- Restricted-area intrusion
- Cargo and vehicle protection
- Theft and tampering scenarios
Make everyday activity measurable.
Turn visible activity into practical operational indicators. Explore material quantities, volumes, work patterns and ergonomic observations to understand what happens across shifts.
- Activity and flow analysis
- Material and volume monitoring
- Ergonomic pattern assessment
 04 / PRODUCTION QUALITY CONTROL
Catch deviations closer to the source.
Extend visual intelligence to production-line inspection. Scope a tailored solution for visible defects, missing components, assembly deviations or packaging inconsistencies, with a pilot based on your products and line conditions.
- Visible defect inspection
- Assembly and component presence
- Packaging and label consistency
 05 / FLEET & LOGISTICS
Keep risk in view, beyond the gate.
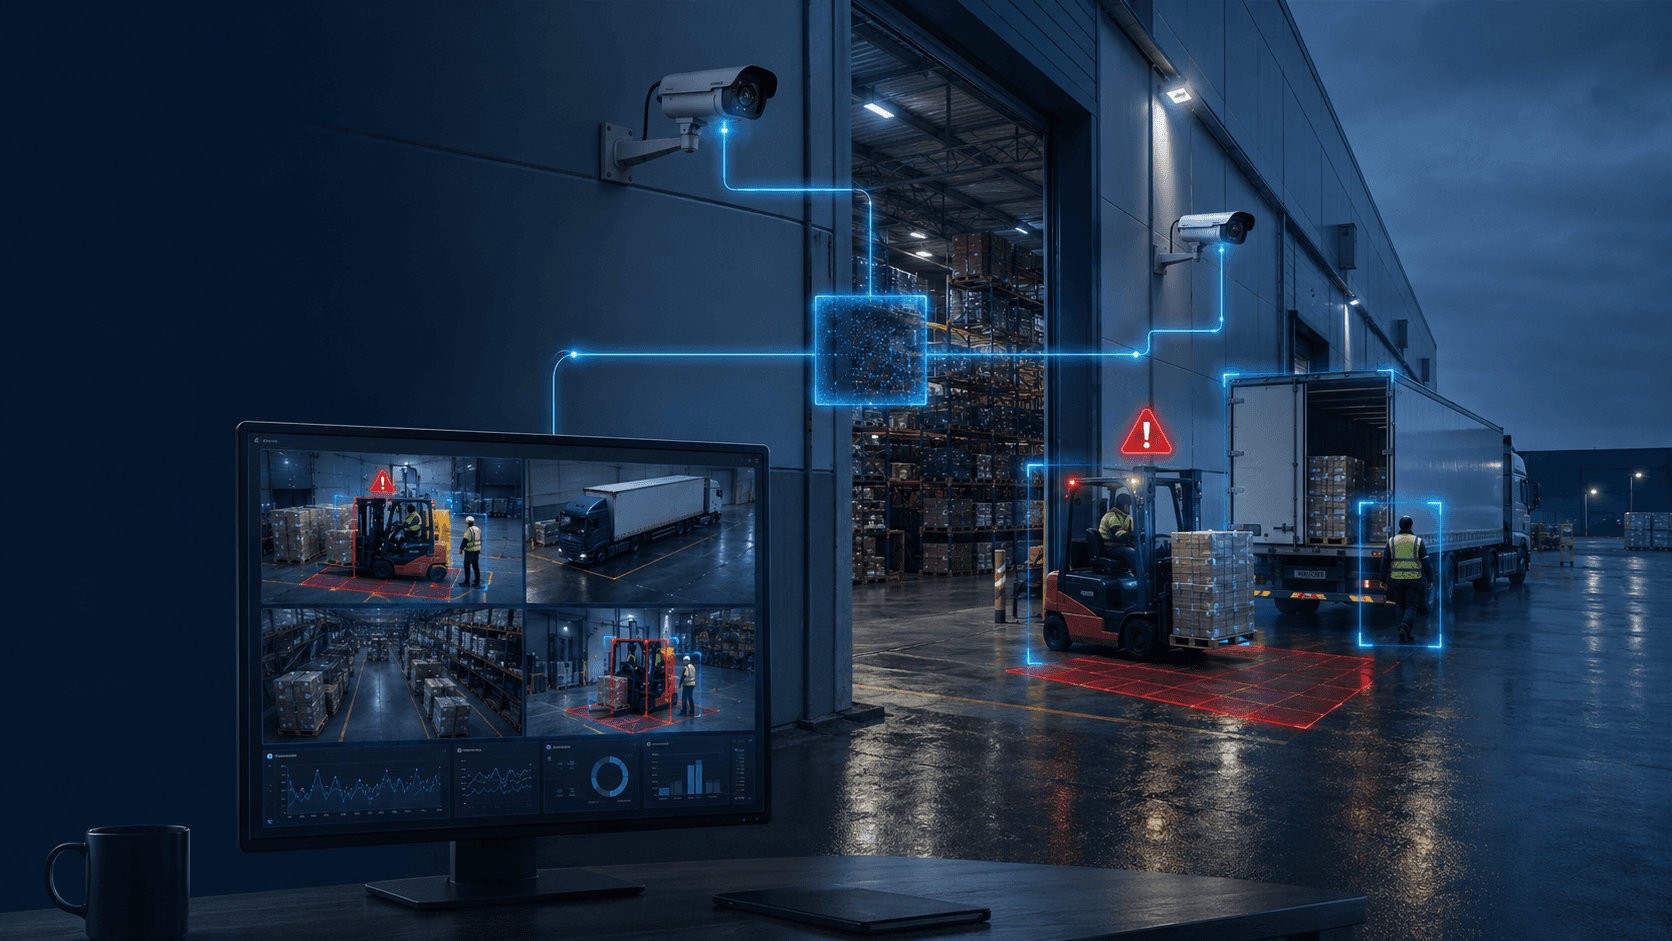
Bring selected vehicle-mounted and site cameras into a common operational approach. Identify relevant events around loading, unloading, yards and transport operations, then preserve the evidence for review.
- Loading and unloading events
- Yard and cross-dock monitoring
- Cargo handling and damage scenarios
 06 / CUSTOM SOLUTIONS
Your process. Your rules. Your use case.
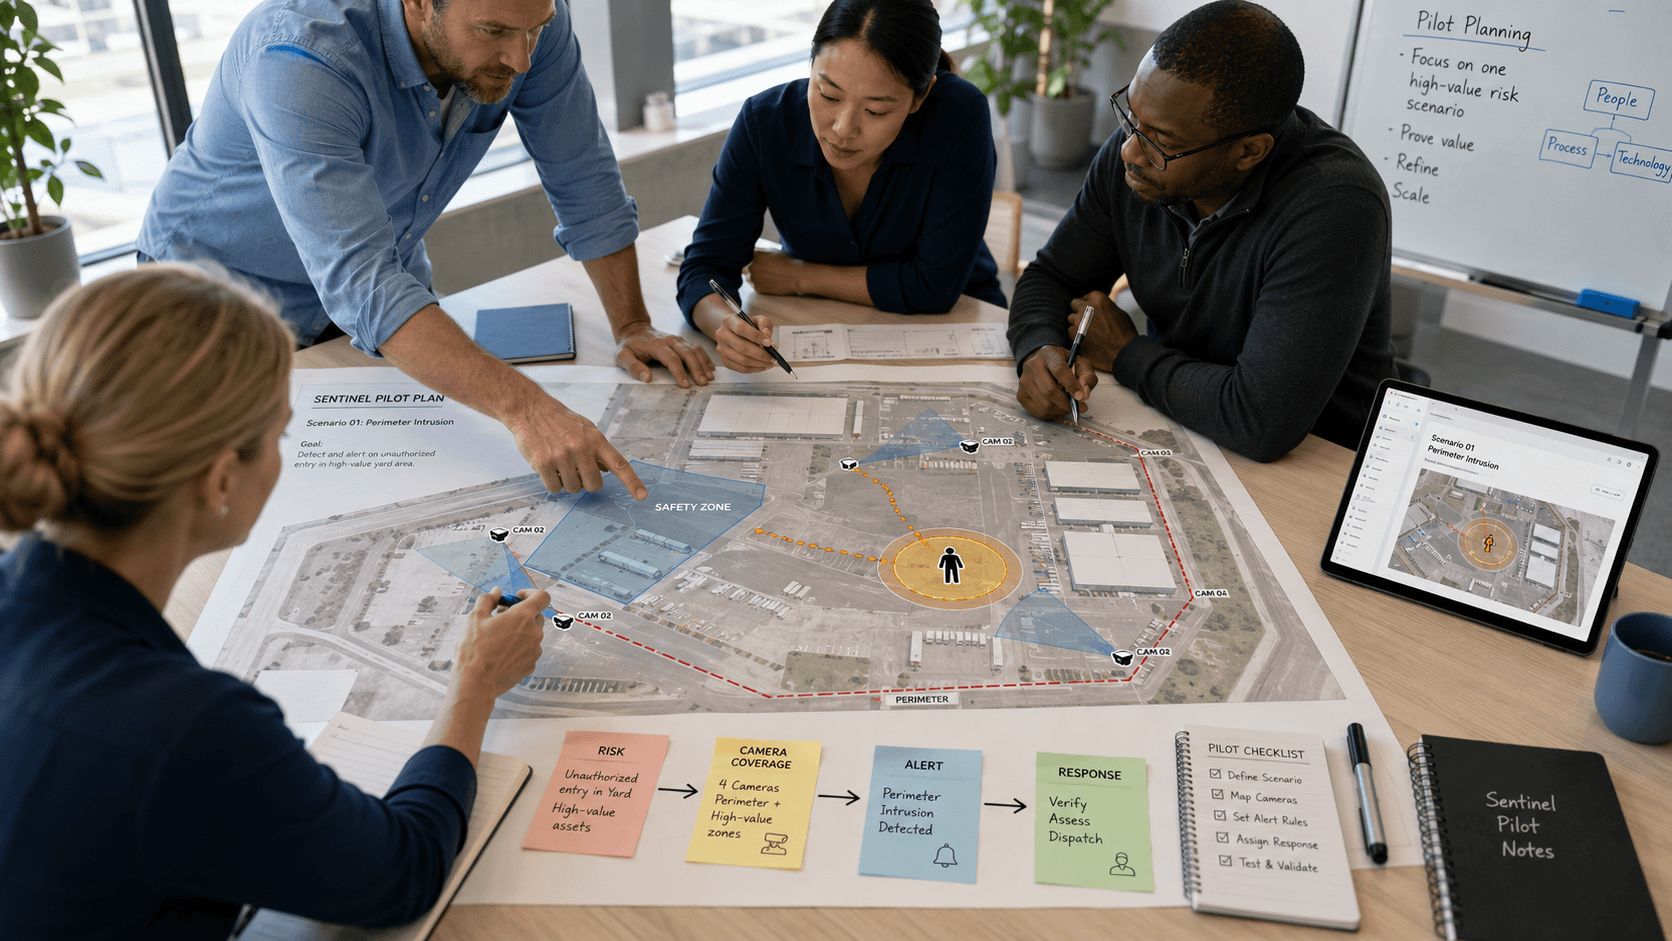
Have a visual challenge that does not fit a standard category? Work with the team to define the event, assess camera coverage, validate feasibility and design an alert or reporting workflow around your operation.
- Process-specific detection logic
- Site-specific rules and thresholds
- Integration requirements assessed together
Understand movement across your premises.
Detect truck licence plates, monitor site speed rules and generate relevant security alerts. Combine vehicle events with movement and dwell-time analysis to understand where trucks wait.
- Licence-plate detection
- Site speed and rule monitoring
- Truck movement and time on site
 08 / DYNTELL DEMONSTRATION
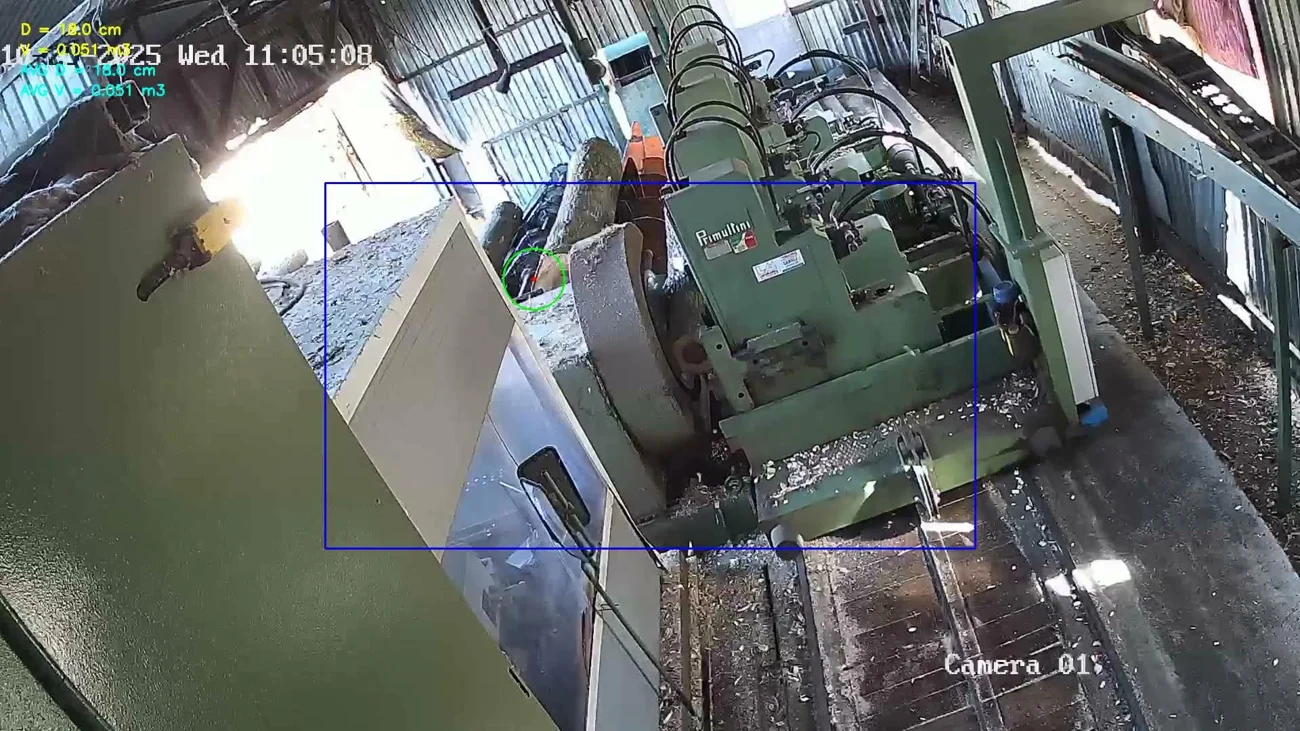
Measure what the camera can see.
Use camera image analysis to measure log dimensions and calculate volume. Define calibration, reference measurements and acceptable tolerances for the material and environment.
- Log dimensions and volume
- Continuous measurement records
- Application-specific calibration
Make work sequences measurable.
Identify defined activities, measure the time spent on them and compare observed workflows with agreed standards. Support review with process evidence and generated reports.
- Activity timing and logging
- Standard-time deviation analysis
- Work sequence and process tracking
 10 / DYNTELL DEMONSTRATION
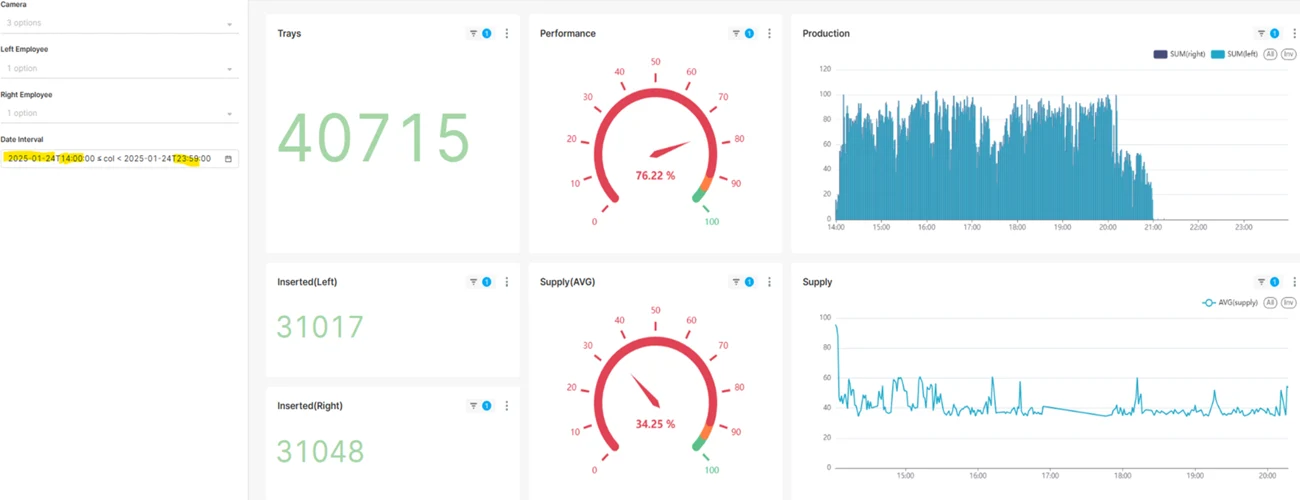
Put observations into operational context.
Bring camera-derived measures into configurable dashboards and KPIs. Give managers useful feedback on group activity, production patterns and site movements.
- Configurable dashboards and KPIs
- Group-level performance feedback
- Reporting and operational review
What should your
cameras see next?
Tell us about your site, your cameras and the problem you want to solve. Let’s define a focused first pilot.